Q.1: What the heck are these s, t
parameters?
First of all, they are the parameters that appear in the
effective bandwidth definition of [Kel96]
When used for the analysis of a link (multiplexer) that guarantees some
level of performance or quality of service (QoS),
parameters s, called the space parameter,
and t, called the time parameter,
characterize the context of the source,
which includes the link resources (capacity and buffer), scheduling
discipline, QoS, and
traffic mix (percentage and characteristics
of the different source types).
Parameter s indicates
the degree of statistical multiplexing: Large values of s
indicate a low degree of statistical multiplexing; such is
the case when we multiplex streams with peak rates not much
smaller than the link capacity. On the other
hand, small values of s
indicate a large degree of statistical multiplexing; such is the
case when we multiplex streams with peak rates much
smaller than the link capacity.
Furthermore, s=infinity corresponds to the
case of deterministic multiplexing (i.e., zero probability of overflow).
A more mathematical interpretation is the following: over the
busy period preceding a buffer overflow the amount of work
produced by a stream is exponentially tilted, with tilt parameter
s.
Parameter t corresponds to the most probable duration of the buffer busy period prior to overflow. Hence, it indicates the time scales that are important for overflow: A small value of t indicates that fast time scales are responsible for buffer overflow, whereas a large value of t indicates that slow time scales are responsible for buffer overflow. Furthermore, parameter t shows the minimum time granularity that traces must have in order to capture the statistical properties that affect buffer overflow.
Q.2: How do they affect
resource usage?
Now consider the parameter t. A
large value of t
indicates that slow time scales are responsible for buffer overflow.
Due to this we have an averaging effects in the quantity
Xj[0,t], which appears
in effective bandwidth definition and is
the amount of workload produced by a
source of type
j in a time interval of length t.
This typically results in a smaller effective bandwidth.
Q.3: Why can they be taken to characterize
a link's operating point?
Q.4: Why are such parameters needed?
Why can't a stream's resource usage be quantified
independent of the link and the other traffic it
is multiplexed with?
Q.5: How can they be computed?
Q.6: Is there some (engineering) intuition on how they
depend on the
link resources (capacity, buffer) and traffic type?
Parameter s: Recall that
,
hence parameter s indicates how much the QoS
increases (the overflow probability decreases)
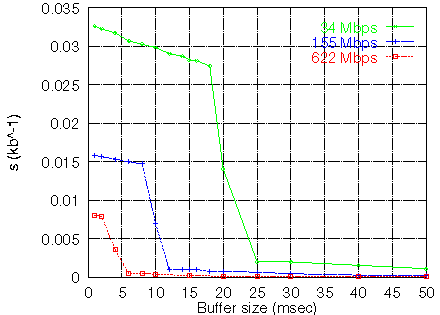
when the buffer is increased. For small values of
B one would expect s
to be large, since the buffer is used to smooth the fast time
scales. Once the fast time scales have been smoothed, the slow
time scales govern buffer overflow. Thus, increasing
the buffer has a very small effect on the overflow probability,
and s is small. The previous behavior is shown
in the following graph.
Also observe that larger link capacities correspond to smaller
values of s.
Star Wars traffic
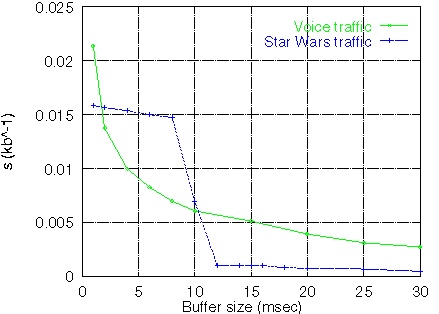
Note that the sharp decrease of the
value of s is due to the nature of
MPEG-1 traffic. Other traffic can possibly have smaller and/or
more jumps, or s can change more smoothly
with the buffer; the latter is the case for voice traffic,
as shown in the following graph.
C=155 Mbps
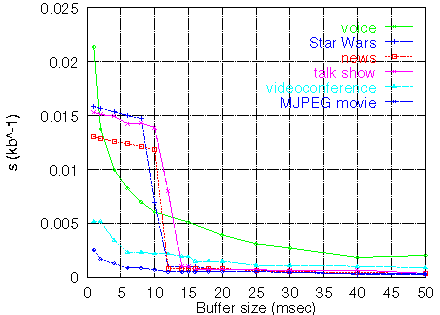
Nevertheless, as shown in the graph below,
s depends more on the structure of the traffic rather
than the content (the graph below shows s for
MPEG traffic with Star Wars, news, and talk show traffic).
The graph also shows s for other traffic types
(videoconference and Motion JPEG).
C=155 Mbps
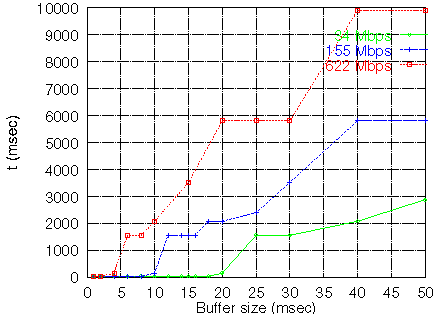
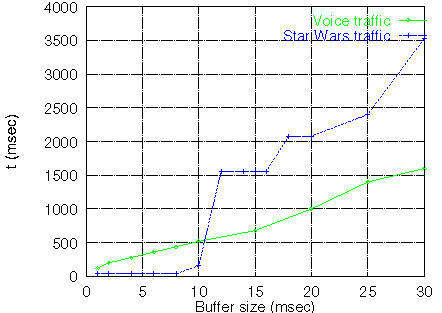
Parameter t: The dependence of
parameter t on the buffer size is shown in the
following graph. Observe that the value of t
increases with the buffer size, this says that the busy
period prior to overflow is typically larger for larger buffer sizes.
Also, larger link capacities correspond to larger values of
t.
Star Wars traffic
Again, t depends on the nature of the traffic,
as shown by the following graph.
C=155 Mbps
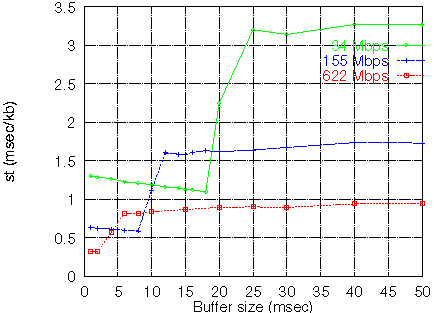
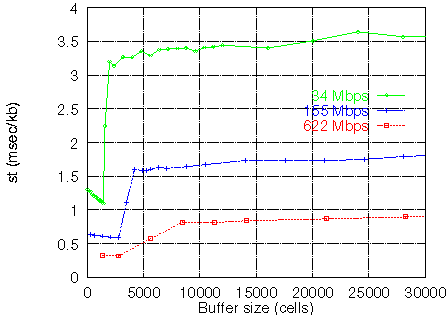
Product st:
The following hold for the product st:
,
hence the product st indicates
how much the QoS increases when the capacity increases.
When there is a large degree of multiplexing st
obtains large values. This occurs because when there is a
large degree of multiplexing, t is large
hence the streams, for the overflow phenomena, appear smooth.
But for smooth traffic, the QoS is affected a lot by changes of the
capacity.
Star Wars traffic
Q.7: How about some typical values for these parameters.
Consider the parameter s. A very large value of
s indicates that the
effective bandwidth is close
to the maximum value of Xj[0,t]/t, which is
the peak rate measured in time intervals of length t.
On the other hand, a very small value of s indicates
that the effective bandwidth is close to the mean rate.
The value of parameters s, t,
in addition to the link resources (capacity, buffer) also depends
on the traffic mix, and hence on each individual source.
However, due to statistical multiplexing, for a large system
this dependence can be ignored. Such an engineering approach
breaks the loop in the definition of the effective bandwidth.
Furthermore, for a large degree of multiplexing the
s, t parameters are to a large
extent insensitive to small variations of the traffic mix. Hence,
periods of the day during which the traffic mix remains relatively
constant can be characterized by particular pairs.
Because both theory (e.g., see [CLW94],[Kel96], [CW96]) and experimentation
with real traffic ([Kni97],
[CSS99] have
shown that the amount of resources used by a stream depends on
the context (i.e., link resources and traffic mix).
Quantifying resource usage independent of a stream's context
can lead to underutilization or even overutilization of link
resources.
Here's an example: Consider three links with capacity
C=34, 155,and 622 Mbps that
multiplex streams with the famous Star Wars traffic. The buffer
size of each link is such that the maximum queueing delay is
4 msec. The effective bandwidth of a single Star
Wars stream in each of the three
links is EB=0.54, 0.33, and 0.28 Mbps
for C=34, 155,and 622 Mbps respectively
(by the way, the mean rate of each stream is approximately
0.26 Mbps).
As this example shows, the effective bandwidth decreases
as the degree of multiplexing increases.
There is more than one approach.
One approach is to directly apply
the supinf formula on traces of real traffic.
Another approach is to calculate them using the interpretation
given in [CKW97]. In particular,
the time parameter t
corresponds to the time scale in which buffer
overflow occurs (or in general, the event which is guaranteed
not to occur to often). The space parameter s
is
,
where .
Hence, s
can be estimated using the ratio of differences
(e.g., see
[CSS99]).
Finally, another approach can be to
set the parameters adaptively, or
based on experience. For this reason, typical values
for these parameters are useful (see Q.7).
Yes there is.
Here is a short discussion (and some intuition) on the dependence of
s,
t,
and the product
st on the link parameters and traffic mix.
A more complete discussion can be found
in [CSS99].
The examples are for actual traces of MPEG-1 video
(in particular for the famous Star Wars traffic stream),
Motion JPEG video,
and modeled voice and videoconference traffic.
Star Wars traffic
I have made available some typical values of s,t for
various link capacities and buffer sizes for the following traffic
types:
MPEG-1 video,
Internet WAN traffic, and
a traffic mix of MPEG-1 video
and voice traffic.
ICS-FORTH Telecommunications and Networks Division Email:
netgroup@ics.forth.gr
Email questions/problems to Vasilios A. Siris, vsiris@ics.forth.gr
Last updated Fri Nov 13 13:59:28 EET 1998