|
Asynchronous Circuit and System Design Group
|
Asynchronous Open-Source DLX Processor (ASPIDA)
|
Marked Graph Representation of De-synchronization model for a linear pipeline and a ring
|
| |
This page presents a formal model for de-synchronization.
The aim is to produce a set of distributed controllers
that communicate locally with their neighbors and
generate the control signals for the latches in such a way that the
behavior of the system is preserved. For simplicity, we assume that all
combinational blocks and latches have zero
delay. Thus, the only important thing about the model is the sequence
of events of the latch control signals.

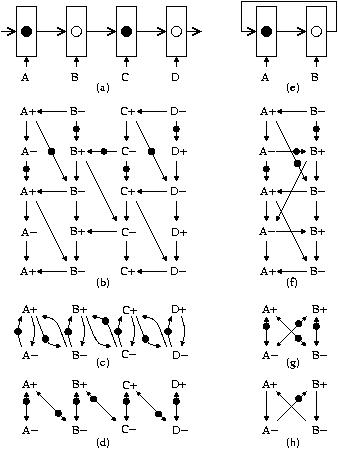
Figure 1
- A+ --> A- --> A+, that simply denote that the
rising and falling transitions of each signal must alternate.
- B- --> A+, that denotes the fact that for latch A to
read a new data token, B must have completed the reading of the
previous token coming from A. If this arc is not present, data
overwriting can occur, or in other terms hold constraints can be
violated.
- A+ --> B-, that denotes the fact that for latch B to
complete the reading of a data token coming from A it must first
wait for the data token to be stored in A. If this arc is not
present, B can ``read a bubble'' and a data token can be
lost, or in other terms setup constraints can be violated.
The marking in Fig. 1(b) represents a state in which all
latch control signals are low and the events B+ and D+ are
enabled, i.e. the latches B and D are ready to read the data
tokens from A and C, respectively.
Figure 1(c) shows the marked graph that derives from the
unfolded graph in Fig. 1(b). A simplified notation is used in Fig 1(d)
to represent the same graph, substituting each cycle x  y by a double arc x y by a double arc x  y, where the token is located close to the enabled event in the cycle
(y in the example).
It is interesting to notice that the previous model is more
aggressive
than the classical one generating non-overlapping phases for
latch-based designs. As
an example, the following sequence can be fired in the model of
Fig (a-d):
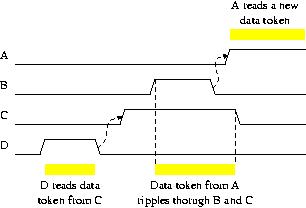
After the events D+ D- C+ B+ ,
a state in which B=C=1 and A=D=0 is reached, where the data token
stored in A is rippling through the latches B and C. A timing
diagram illustrating this sequence is shown in
Fig. 2

Figure 2
|
|

 y by a double arc x
  y, where the token is located close to the enabled event in the cycle
(y in the example).